![]()
Chapter 14
*Performance Tuning
*Exercise 14-2 Splitting the Paging File Among Multiple Disks *
Exercise 14-3 Changing the Foreground Application Responsiveness *
Exercise 14-4 Changing the Priority of a Running Process *
Exercise 14-5 Starting Processes with Other Than Normal Priority *
From the Classroom *
Performance Monitor
*Processor Performance *
Exercise 14-7 Adding Processor: %Processor Time to the Performance Monitor *
Exercise 14-8 Adding Processor: Interrupts/sec to the Performance Monitor *
Exercise 14-9 Adding System: Processor Queue Length to the Performance Monitor *
Disk Drive Performance *
Exercise 14-10 Enabling the Disk Drive Performance Counters *
Exercise 14-11 Adding Memory: Pages/sec to the Performance Monitor *
Exercise 14-12 Adding LogicalDisk: %Disk Time to the Performance Monitor *
Exercise 14-13 Adding LogicalDisk: Disk Bytes/sec to the Performance Monitor *
Exercise 14-14 Adding LogicalDisk: Average Disk Bytes/Transfer to the Performance Monitor *
Exercise 14-15 Adding LogicalDisk: Current Disk Queue Length to the Performance Monitor *
Exercise 14-16 Disabling the Disk Performance Counters *
Memory Performance *
Exercise 14-17 Adding Memory:Page Faults/sec to the Performance Monitor *
Exercise 14-18 Adding Memory:Pages Inputs/sec to the Performance Monitor *
Exercise 14-19 Adding Memory:Page Reads/sec to the Performance Monitor *
Certification Summary
*Two-Minute Drill
*Self Test
*
Chapter 14
![]()
| Performance Tuning | |
| Performance Monitor |
One might ask, why is it important that you keep your car tuned? One might also ask, why is it necessary to tune your Windows NT system? Just as it’s important that your vehicle be tuned to allow for maximum efficiency, it’s important to optimize your Windows NT system, in order to maximize its capability.
Windows NT has several methods available, by which to maximize its potential. Prior to optimizing your Windows NT system, you must be able to recognize where bottlenecks may exist. In the first section of this chapter we examine what a bottleneck is, and methods for detecting and eliminating them. Next we look at self-tuning mechanisms, by which Windows NT can optimize itself.
No discussion of optimizing Windows NT would be complete without mention of the Performance Monitor application, which we discuss in the second section of this chapter. The Performance Monitor is a valuable tool in assisting you with diagnosing bottlenecks within your system.
Performance-tuning Windows NT 4.0 is the art of taking your existing configuration and maximizing its performance to achieve the optimal outcome. It is a systematic approach that starts by finding the process that is hindering your system the most, and resolving it. However, tuning your system does not stop there; it is an ongoing process.
In this section we exam what a bottleneck is, ways to detect bottlenecks, and ways they can be eliminated. After our discussion on bottlenecks, we move on to ways in which Windows NT assists you in helping your machine run smoothly.
Imagine you are drinking your favorite soda from a bottle. As you look at the bottle you see that the bottom of your soda bottle is wider than the neck. If you turn the bottle upside down the flow is restricted, due to the narrowness of the neck. The term bottleneck within the computer industry indicates a component within your system, whose limitations impede the system as a whole from operating at its maximum potential. Another way to look at this is that a bottleneck is the resource that consumes the most time while a task is executing. One indication that you have a bottleneck is a high rate of use on one resource, while other resources have a relatively low usage rate.
All computer systems have bottlenecks that impede their performance capabilities. You may never notice a bottleneck within your system, depending on how you use your system. If you routinely use it to balance your checkbook, it may perform fast enough for you that you do not see a noticeable bottleneck. On the other hand, if you use it for designing a 3D CAD drawing of the room you’re adding to your house, and it slows down immensely while rendering, then you definitely will notice that you have a bottleneck.
However, just knowing your system is slow does not help you in identifying what resource may be causing the problem. Is it the memory, the hard disk drive, the processor, or possibly an application, or Windows NT service? If you constantly have to fetch data from your paging file, is the hard disk causing the problem, or a lack of memory in your system? If your system slows to a crawl, is it due to processor-intensive calculations or an application that is stealing processor time?
To determine what is the bottleneck in your system, you must evaluate a set of metrics based upon the number of requests for service, the arrival time of the requests, and the amount of time requested. Usually, the resource with the lowest maximum throughput capability becomes the bottleneck if it is in high demand. It is important to realize that a resource doesn’t have to be at 100% utilization for a bottleneck to occur. Later in this chapter, when we begin using the Performance Monitor, we will discuss different levels of utilization that typically indicate a bottleneck.
The Task Manager is a useful tool for short-term monitoring of your system and can be extremely valuable in detecting an application or Windows NT service that has become a CPU or memory bottleneck. Using the Task Manager, you can see which applications and processes, and the number of threads that are running in your system. While an application is listed under the Application tab, it is also listed in the Processes tab, along with other processes such as Windows NT services and drivers. A single process can have one thread or many threads running at the same time. A thread is what allows a process to run different portions of its program concurrently (and possibly on different processors, which we will look at in detail, later in the chapter.) Figure 14-1 displays the Task Manager Processes tab. A process is running that is consuming more memory than it should, thereby slowing the system. Can you identify it?
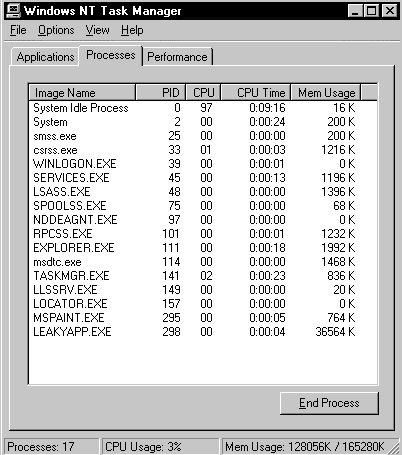
If you said that LEAKYAPP.EXE looks like it is using more memory than it should, you are correct! This is just one way that the Task Manager can help you determine bottlenecks within your system.
Now it is your turn to start up the Task Manager and take a look at what is happening within your system. Exercise 14-1 leads you through the steps of starting up a few applications and looking at all three tabs on the Task Manager. These three tabs help you detect application and Windows NT services bottlenecks within your system.
Exercise 14-1 Viewing Applications, Processes, and Threads
Once you have determined that you have a bottleneck, you are halfway to solving your problem and speeding up your system. The steps you take in eliminating the bottleneck vary, depending on what type of bottleneck you have. In some situations you might need to terminate an application. In Figure 14-1 simply highlighting LEAKYAPP.EXE and clicking the End Process button can solve the bottleneck. In other situations you may need to add more memory, a faster hard disk, or more processors.
Once you have eliminated the most significant bottleneck in your system, try to find the next bottleneck and eliminate it. Performance Tuning is a constant cycle of improvement and there is always a bottleneck to overcome, unless your system is so fast that you do not perceive a bottleneck.
Windows NT ships with several mechanisms in place to assist with optimizing your system performance automatically, including:
| Methods to avoid fragmentation of physical memory | |
| Utilizing multiple pagefiles | |
| Multiprocessing capability | |
| Thread and process prioritization | |
| Caching disk requests |
Methods to Avoid Fragmentation of Physical Memory
Windows NT utilizes two types of memory, physical memory, which is the actual RAM, and virtual memory, which is hard disk space acting as though it is additional RAM. Virtual memory is used when the amount of physical memory is not enough to run the current applications, processes, and threads. Data is transferred transparently between physical memory and virtual memory under the control of the virtual memory manager (VMM). The VMM swaps unused data from RAM to the hard disk, and swaps in data from the hard disk to RAM so that it can be accessed faster.
The size of the smallest portion of memory that can be managed is 4KB (kilobyte). This 4KB section of memory is called a page. Both physical memory and virtual memory (the file stored on the hard drive is called PAGEFILE.SYS) are treated equally with regard to the size of the pages. This allows the virtual memory manager to manipulate data that is being moved back and forth between physical memory and virtual memory, without having to worry about different page sizes. Any available space in physical memory or virtual memory can be used for the transferred page without the need to worry about a large amount of fragmentation.
Fragmentation occurs when there is unused space within contiguous pages. If there is sufficient fragmentation, you have areas of memory that cannot be used by other applications, leading to wasted memory. Other operating systems do not use 4KB pages, but use much larger pages—up to 64KB in size. Let’s do a comparison of storing data within a Windows NT 4KB page and another operating system that has a 64KB page size. If there were 3KB of information stored within a 64KB page, 61KB of that memory is wasted. If that same 3KB of data were stored within a Windows NT page, there would only be 1KB of unused memory. Another example would be if we have a thread executing that needed 26KB of memory. On Windows NT it uses 7 pages (7 x 4KB = 28KB), with only 2KB being unused. On the operating system that uses 64KB pages, 38KB of memory is wasted. Keep in mind that this example is for only one thread. Remember when you performed Exercise 14-1 and saw the number of threads running in your system? Now imagine the amount of memory that would be wasted if Windows NT did not use 4KB pages. By optimizing the size of the pages in this manner Windows NT leaves more physical memory available for use by your application, without having to do as much swapping to virtual memory. It is important to have as much physical memory in your system as possible, to reduce the page swapping that the virtual memory manager has to perform.
It is not always possible to add more memory to your system to reduce page swapping, but the virtual memory manger within Windows NT can recognize more than one pagefile. When you first launched the Windows NT setup program, it created a file called PAGEFILE.SYS on the physical drive on which the operating system was being installed. The default size of PAGEFILE.SYS is the amount of physical RAM plus 12MB (megabyte).
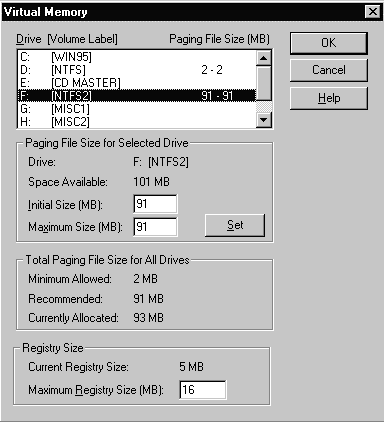
It is possible to have more than one pagefile if you have multiple logical or physical drives. Windows NT supports a maximum of 16 pagefiles per system. There can be one pagefile per logical disk, but for maximum efficiency you should create additional pagefiles—one per physical disk. The reason you want to place the additional pagefiles on separate physical drives is that you will see significantly increased levels of input/output (I/O) if your hard disk controller is capable of reading and writing to multiple hard disks at the same time. If you place additional pagefiles on logical drives, you may notice a slowdown in your system as the drive head has to move between the multiple pagefiles that exist on the physical drive hosting the logical drives. Exercise 14-2 shows you how to split your paging file among multiple hard disks. Keep in mind that to perform this exercise you must have more than one physical drive in your system.
Exercise 14-2 Splitting the Paging File Among Multiple Disks
Figure 14-2 shows multiple pagefiles in use on a Windows NT system. Notice that the minimum pagefile size that Windows NT allows is 2MB.
Windows NT can increase the performance of your system by taking advantage of more than one processor in a system. In a single-processor system, only one thread can be executed at a time. In a multiprocessor system, each processor can handle a thread, thereby improving performance.
Not all multiprocessing systems are created equal. A multiprocessing system falls into one of two different categories: asymmetric or symmetric. An asymmetric multiprocessing (ASMP) system assigns specific threads to a specific processor, which could lead to wasted processor time, if one processor is waiting on a thread that is not being executed. An example of asymmetric multiprocessing would be if the operating system was running on one processor, and applications were running on the other processor. When an application is not running, that processor sits idle. Figure 14-3 shows an asymmetrical multiprocessing system with four processors. As you can see, Processor 1 is being used for the operating system, and Processor 3 for an application. Processors 2 and 4 are not being utilized and thus are wasted.
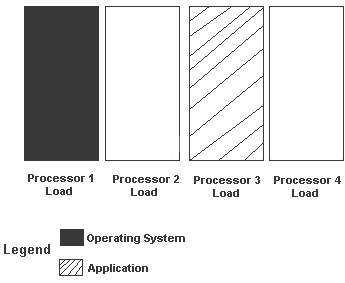
Figure 3: In Asymmetric Multiprocessing, memory can be wasted.
By contrast, a symmetric multiprocessing (SMP) system uses any available processor, as needed. Windows NT supports symmetric multiprocessing, which allows it to distribute application needs and system load evenly across all the available processors. Figure 14-4 shows a symmetrical multiprocessing system with four processors. Each processor is sharing in the load of the operating system and the application.
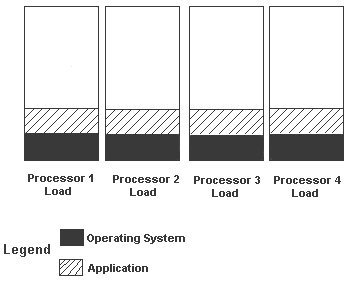
Figure 4: In Symmetric Multiprocessing, the load is distributed.
Multiprocessing systems do not double the performance capability of two-processor systems, as you might think they would. Overhead for resource sharing and scheduling must be factored in. It is generally accepted that two processors give you roughly 150% of the performance of one processor, but this depends on how your system is used.
Windows NT Workstation supports two processors out of the box. If you need support for more than two processors, contact your computer manufacturer to acquire the appropriate support files.
Exam Watch: Many people taking the exam get confused by the number of processors that are supported by Windows NT Workstation and Windows NT Server. Be sure to recognize the differences in supported quantities of processors between the two different operating systems as they are shipped.
Thread and Process Prioritization
As we discussed earlier in this chapter, a process can be made up of multiple threads that are executed at the same time in a multiprocessing system. However, if you look at a preemptive multitasking operating system, it only appears that the threads are being processed at the same time. In reality, the threads are processed based upon their priority. Since Windows NT is a preemptive multitasking operating system, there must be a way to manipulate the priorities of the processes and threads. Windows NT always schedules the highest-priority thread to run, even if it has to interrupt a lower-priority thread. In this way, it keeps the processor running the highest-priority task.
The priorities within Windows NT are handled in a hierarchical manner, and have a number range of 0 to 31, with 31 being the highest priority. The priorities fall into one of the four base priority classes. Table 14-1 illustrates the four classes and the priority numbers associated with them. Each process starts with a base priority of 7, which is within the normal base priority. The threads of a process inherit the base priority of the process. Windows NT can raise or lower this number by two priority levels, which allows the system to prioritize itself as it is running.
Base Priority |
Number Range |
Low |
0-6 |
Normal |
7-10 |
High |
11-15 |
Real-time |
16-31 |
Table 1: Base Priorities for Processes and Threads
If there are multiple threads running at the same priority, they share the processor by taking equal turns until the threads have finished. Periodically, all threads receive a priority boost from Windows NT. This helps to prevent the lower-priority threads from locking onto a shared resource that may be needed by a higher-priority thread.
Dynamic applications use priority levels 0-15, while real-time applications operate with the priority levels from 16-31. A dynamic application would be a user application or operating system component that is not critical to the performance of the system and may be written to the pagefile. A real-time application would be a mouse driver that is critical to system performance and therefore cannot be written to the pagefile. Real-time applications access the processor quite frequently in order to respond to a real-time event, such as a user moving the mouse cursor across the monitor screen.
It is important to note that, in order to start a process with a priority higher than 23, you must be an administrator. This is because a process running at this high a priority really slows the entire system down and makes even moving the mouse cursor a slow procedure.
As already discussed, Windows NT can automatically change the priorities on processes. For example, if you bring an application to the foreground, the operating system automatically raises the priority level of the processes that the application is running, to make sure that it responds to your requests quickly.
It is possible to change the responsiveness of the foreground application by adjusting the Application Performance Boost slider. Figure 14-5 shows the Performance tab from System Properties, where the Application Performance Boost slider is located. As indicated by the hash marks under the slider, there are three possible settings for boosting the foreground application. The Maximum setting increases the foreground application by two priorities. If you have an application that started with a priority of seven, and move the slider to the Maximum position, it raises the priority level to nine as long as the application is in the foreground. The middle setting increases foreground application priority by one priority level. With the slider set to the None position, the foreground and background applications run with the same priority level. Exercise 14-3 shows how to change foreground application priority levels.
Exercise 14-3 Changing the Foreground Application Responsiveness
Be sure to set the Application Performance Boost slider back to Maximum after you have completed experimenting with the None setting.
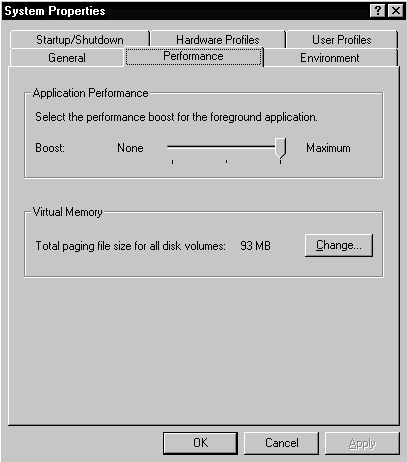
If you have several applications running and you want them all to operate at a high-priority level regardless of which application may be in the foreground, you can adjust the behavior of Windows NT by manually changing the applications while they are running or before they are started.
To manually change the priority of an application that is already running, use the Task Manager. Priority levels changed with the Task Manager remain in effect as long as the process is running. Figure 14-6 shows an example of changing the priority for TCPSVCS.EXE. Exercise 14-4 shows you how to use the Task Manager to change the priority of an application that is already running.
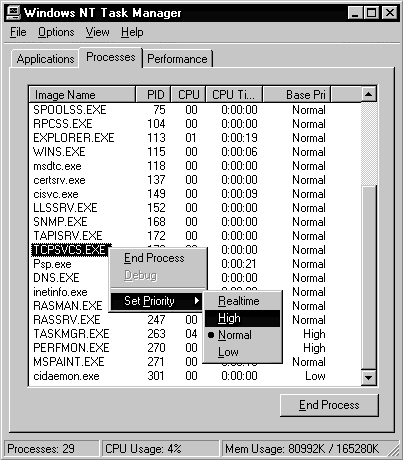
Exercise 14-4 Changing the Priority of a Running Process
If you want to start a process at a higher priority, start it from a command prompt, using one of the switches listed in Table 2. Exercise 14-5 shows you how to start a process with a priority other than normal.
Switch |
Priority Level |
/LOW |
4 |
/NORMAL |
7 |
13 |
|
/REALTIME |
24 |
Table 2:Command Line Switch Settings to Change Process Starting Priority
Exercise 14-5 Starting Processes with Other Than Normal Priority
Windows NT improves the performance of your system by utilizing disk caching, which the disk cache manager controls. The disk cache manager reduces the amount of I/O traffic to your hard drive. It does this by storing frequently-used data in physical memory, rather than having to read it each time from your hard disk. Reducing the amount of I/O increases your system performance.
The caching system is dynamic, so the size of the cache file changes as necessary, based upon the amount of memory that the operating system requires. If you start a new process, Windows NT changes the cached memory that is available, to ensure a balance between the memory used for caching and the virtual memory pagefile. This maximizes the physical memory that is present.
It is not possible to configure manually the size used by the cache, since the size is determined by all the applications running on the system. The best way to optimize the size of the disk cache is to have as much physical memory as possible in the system. This allows Windows NT sufficient resources to manage itself optimally.
In most situations the tuning that Windows NT performs on itself is sufficient to have an optimally configured system. However, in those cases where self-tuning does not solve your problems, you need to turn to other methods of optimization such as the Performance Monitor.
The Dangers of Dual-Boot Machines
Many clients, especially if they are new to NT, want to configure their computers with both NT and the operating system they have in place. This scenario is common enough that we create a dual-boot operating system in the classroom so the students have some experience in the environment. We find that most clients dual-boot between NT and DOS (or DOS/WIN.) Over the past several years, the upgrade choice has been between Windows NT and Windows 95. As NT’s popularity has grown, and the next release of Windows 95 (called Windows 98) is around the corner, we see more upgrades to NT from Windows 95. Users prefer to upgrade to NT, rather than upgrade from Windows 95 to Windows 98, and then be faced with an upgrade to NT later.
The first point to remember, when setting up a dual-boot machine, is to have DOS (or Windows 95) installed first, and then install NT. If you try it the other way around, you won’t be able to start NT after you make the hard disk a DOS-bootable drive. When you install NT, the installation process makes an image of the DOS boot sector and stores it in a file called BOOTSEC.DOS. Don’t delete this file. When you start your computer, you are presented with the Boot Loader Menu. When you select DOS from the menu, NTLDR needs the information in BOOTSEC.DOS in order to start DOS.
The second point to remember concerns the C: drive. We feel that it is most effective to have each operating system on its own separate partition. Experience has shown that this is an easier way to manage the system. Whether you create separate partitions or not, you must pay close attention to the file system for the C: drive. On a dual-boot machine, the file system must be FAT. After working with NT for a while, you will become comfortable with the NTFS file system and the features and benefits that it has to offer. And there is the really neat little command-line utility to convert your FAT partitions to NTFS partitions without destroying the data. Just run the utility, wait a few seconds, reboot the machine (in some cases you don’t have to reboot the machine) and you’re done. What could be easier? Maybe it’s too easy. If you get carried away and convert the C: drive (which is a FAT partition so that DOS will boot) to NTFS, you can’t dual-boot to DOS again. And there’s no way to convert from NTFS to FAT, so you’re stuck. Don’t underestimate the possibility that this could happen to you. In the classroom, we stress this point before the students do the conversion exercise. Yet, in a class of 10 students, we can count on at least one mistakenly converting the C: partition instead of the D: partition. If this can happen in the relatively controlled environment of the classroom, imagine what can happen in the chaos of the real world.
The Performance Monitor is a tool included with Windows NT 4.0 that tracks the performance of system components and applications. By tracking different components of your system, it can help you to see what is degrading the performance. The Performance Monitor can serve a variety of purposes.
| Identify bottlenecks | |
| Identify trends over a period of time | |
| Monitor real-time system performance | |
| Monitor system performance history | |
| Determine the capacity the system can handle | |
| Monitor system configuration changes |
The Performance Monitor is used to establish a baseline of your system. A baseline is a snapshot of your system under normal operating conditions, and a yardstick to measure future abnormalities. When you start Performance Monitor, as with any application, you use a portion of processor time to run the program. If you turn on the switch that allows disk monitoring, that minimally affects I/O for the local hard disk. This should, in essence, have no effect on the results of the measurements you are taking. Figure 14-7 shows the Performance Monitor after it has first been started. Exercise 14-6 shows you how to start the Performance Monitor on your system. It is best to make sure that your hard disk has finished all logon processing prior to starting the Performance Monitor. This ensures that your results do not include any of the logon processing.
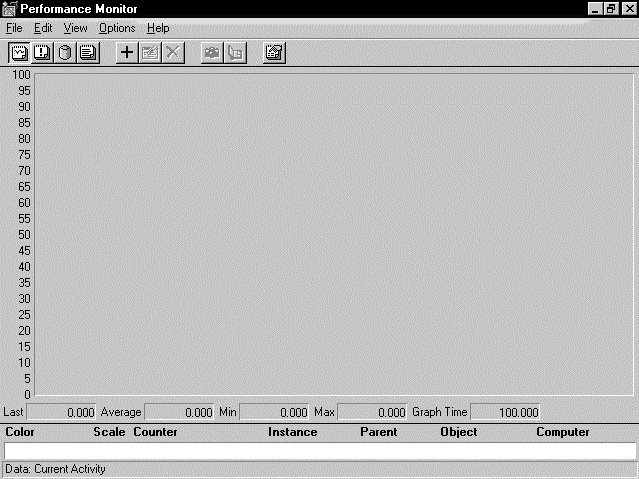
Exercise 14-6 Starting the Performance Monitor
Performance Monitor utilizes three different types of items to view the system. They are objects, counters and instances.
| Objects are system components, such as Memory, Processor, or Disk. See Table 3 for other Objects. | |
| Counters are specific features of the Object that you have chosen. For example, the %Processor Time is a counter for the Processor object. Objects can be made up of many different counters. | |
| An instance is a single occurrence of a counter activity. An example would be if your system has two processors and you start the %Processor Time counter for each processor. |
Measurements are always occurring throughout the processes running on your Windows NT system. The Performance Monitor is the tool that displays this measurement based upon which objects you choose.
Counters are incremented each time an object performs its functions. For example, each time the processor services a request from an I/O device, the interrupts/sec counter would be incremented.
Many of the counters are used by Windows NT so that it may monitor itself and perform self-tuning. Table 3 lists several of the objects that can be measured with Performance Monitor. This list is not exhaustive, and your applications may be written to let the system monitor their performance via objects.
Object Name |
Description |
Browser |
Monitors browser activity for the domain or workgroup to include elections and announcements |
Cache |
Monitors the disk cache usage |
LogicalDisk |
Monitors hard disk partitions |
Memory |
Monitors memory usage and performance |
Paging File |
Monitors the usage of pagefiles |
PhysicalDisk |
Monitors a hard disk that contains one or more partitions. This object can be used to monitor the whole drive instead of individually monitoring partitions. |
Process |
Monitors all processes that are running on the system. |
Processor |
Monitors each processor in the system |
System |
Monitors counters that affect all hardware and software in the system. |
Thread |
Monitors all threads running in the system |
Table 3: Description of Objects Measured by Performance Monitor
Creating a Performance Monitor Chart
A Performance Monitor chart measures the objects that you add and reflects the current activity. If you save the chart under a filename, it performs constant logging, which you can view whenever you want to see an update of the measurement.
Figure 14-7 shows the Add to Chart dialog box. As you can see, you can vary the color, scale, width, and style of each counter that you add to the chart. When Performance Monitor is started, it uses a default scale. However, if you are viewing more than a single counter, you may want to utilize a different scale than the default on each counter, in order to analyze the data appropriately.
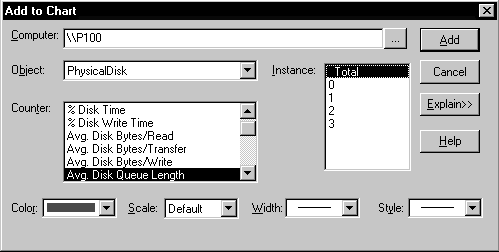
Analyzing a Performance Monitor Chart
A chart like that shown in Figure 14-7 shows the activity of every object, counter and instance that is being monitored. The scale on the left of the chart always starts at zero and is displayed by default. The scale can be changed if your activity goes above one hundred. The default time interval is set to one second for each counter. Table 4 describes the other values displayed by the Performance Monitor.
Value |
Purpose |
Last |
Displays the counters value during the last poll |
Average |
A running average of the counter during the charts history |
Minimum |
The minimum value of the counter during the charts history |
Maximum |
The maximum value of the counter during the charts history |
Graph Time |
The total amount of time it takes for a complete chart to be created across the screen |
Table 4: Performance Monitor Value Bar Descriptions
When you use the Performance Monitor, it is important to monitor actions that can cause bottlenecks in your system. In the following sections we will use Performance Monitor to examine processor performance, disk drive performance, and memory performance. As you will notice in the following discussions, things are not always as they appear at first. The item that you suspect to be causing your bottleneck might, in reality, be disguising the real bottleneck.
Normally, within your computer the processor is the fastest component, and tends to waste a lot of time waiting on other processes. The processor in modern systems is usually not the bottleneck in a system, unless you are using applications that are very graphical or math-intensive. However, you might want to measure the performance of your processor to ensure that a bottleneck is not present, especially if you are using a earlier processor than one from the Pentium family.
When monitoring processor performance there are three important counters to observe.
| Processor:%Processor Time | |
| Processor:Interrupts/sec | |
| System:Processor Queue Length |
The Processor:%Processor Time counter is an indicator of how busy the processor in your system is. There is no need to be alarmed if your processor has spikes of 100%, as this is expected in some situations, such as starting up an application. However, a bottleneck can occur if your processor is so busy that it does not respond to service requests for time. If you are experiencing a consistent processor load of 80% or more, then you have a processor bottleneck. Exercise 14-7 will lead you through the steps necessary to add the counter to the Performance Monitor.
Exercise 14-7 Adding Processor: %Processor Time to the Performance Monitor
Let your system sit idle for a few seconds and then open up any application, such as Notepad. What happens to your Performance Monitor chart? You should see quite a bit of %Processor Time measurement being recorded as the application is opening.
The Interrupts/sec counter measures the rate of service requests from I/O devices. If you see a significant increase in the value of this counter, without an equal increase in system activity, then a hardware problem exists, in which a component is not working properly. This counter should not normally be above 1000, however an occasional spike above 2000 is acceptable. Exercise 14-8 shows you how to add this counter to your system.
Exercise 14-8 Adding Processor: Interrupts/sec to the Performance Monitor
The System:Processor Queue Length counter is an important indicator of system performance, as it watches the number of threads that are asking for processor time. Each thread requires a certain amount of processor cycles. If the demand for processor cycles exceeds what the processor can supply, a long processor queue develops and degrades system performance. You should never have a sustained processor queue that is greater than two. If you have a queue that is higher than two, there are too many threads waiting for the processor, and the processor has become a bottleneck. Exercise 14-9 shows you how to monitor the processor queue length.
Exercise 14-9 Adding System: Processor Queue Length to the Performance Monitor
Processor Performance Troubleshooting
Once you have determined that the processor in your system is causing the bottleneck, do not automatically go out and buy a new processor. There are some things you can check within your system to see if they are causing the processor to be a bottleneck.
| Check to see if the processor only becomes a bottleneck when a certain application is running. If so, find a new application to replace it (if feasible). Screensavers, especially OpenGL screensavers, are very processor-intensive. | |
| Check that your level 2 cache (L2 cache) has been enabled in your Built In Operating System (BIOS). If your L2 cache has not been enabled, it puts a strain on your processor. | |
| Check that you have a sufficient size of L2 cache. At a minimum, you should have 256KB of L2 cache. If you have recently added physical memory to your system, you might want to increase the size of your L2 cache (if your mainboard allows it). After you add physical memory to a system, the L2 cache must map the larger physical memory, which can result in a lower cache hit ratio, and more work for the processor having to retrieve data from other I/O devices. | |
| Check to see if you are using low-bit network or disk adapter circuit cards. An 8-bit card uses more processor time than a 16-bit card, and a 16-bit card uses more processor time than a 32-bit card. Using a 32-bit card provides the most efficiency for your system, since it transfers the most bits of data on each transfer from the card to memory. |
If after checking the preceding items, you still have a processor bottleneck, you might have no other choice but to replace the processor in your system. If your mainboard supports multiprocessing, add another processor.
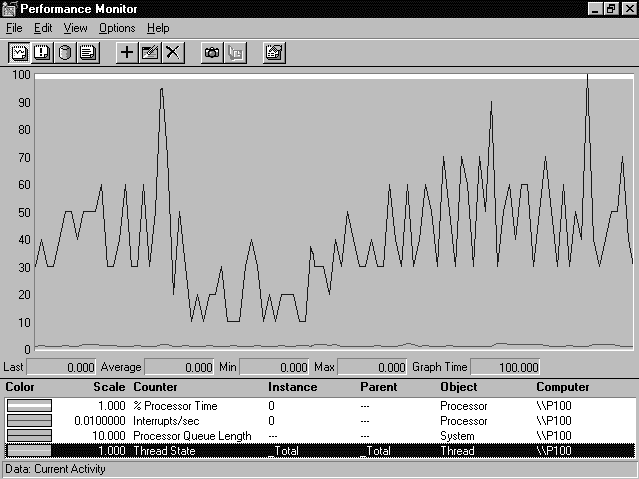
Figure 14-9 shows a processor bottleneck that has been caused by a screensaver. The %Processor Time counter is the white line. As you can see, the screensaver has kept the processor in use 100% of the time, which prevents other tasks from operating efficiently.
Disk drives contribute significantly to creating a bottleneck in your system. The hard disk in your system participates in everything from booting your system and loading applications, to storing and retrieving data from your hard disk and pagefile. With your hard disk involved in all these processes, you can see that the speed of your drive can impact the performance of your system.
The first sign that you might have a disk drive bottleneck could be the amount of time that the disk drive indicator stays illuminated. This should be verified by using the Performance Monitor. If the Performance Monitor shows sustained rates of disk activity above 85%, a disk drive bottleneck is present. Keep in mind that the disk drive might not be the root cause of the bottleneck, so you need to investigate further to make a final determination.
Table 3 showed you a sampling of Objects that can be monitored with Performance Monitor. If you recall there were two Objects that were related to disk drive performance, LogicalDisk and PhysicalDisk. The LogicalDisk Object measures performance at a much higher level than the PhysicalDisk Object does.
The LogicalDisk Object can measure the performance of a partition of a hard disk that has been assigned a drive letter such as C: or D:. Initially, this is a good way to detect a disk drive bottleneck before moving on to use the PhysicalDisk Object. Another good use of LogicalDisk is to monitor which partition may be busy due to a particular application.
The PhysicalDisk Object measures real transfers to and from actual hard disks, and not just partitions. You use this object when you want to isolate differences in performance between drives in your system, or if you want very detailed information about the performance of a specific drive.
To monitor either LogicalDisk or PhysicalDisk performance, you must enable the Disk Drive Performance Counters by running the Diskperf utility. These counters are disabled by default, as they degrade overall system performance by interrupting the processor during I/O. The counters should only be enabled when you want to monitor disk performance, and should be immediately disabled upon completion of your monitoring. When you enable the counters, Diskperf installs the Disk Drive Performance Statistics Driver that actually collects the data for Performance Monitor, and also a high-precision timer that times each disk drive transfer. The driver and timer have been measured to take 1% – 2% of overhead on Intel-based processor systems.
In order to run the Diskperf utility, you must belong to the Administrator’s local group. Exercises 14-10 show you how to enable the Disk Drive Performance Counters.
Exercise 14-10 Enabling the Disk Drive Performance Counters
Exam Watch: You must use diskperf –ye if you want to monitor a physical drive in a stripe disk set. Using diskperf –ye installs the Disk Drive Performance Statistics Driver low in the disk driver stack, so that it can see individual physical disks before they are logically combined.
When monitoring disk drive performance, there are four important counters to observe.
| Memory: Pages/sec | |
| %Disk Time (Applies to both LogicalDisk and PhysicalDisk Objects) | |
| Disk Bytes/sec (Applies to both LogicalDisk and PhysicalDisk Objects) | |
| Average Disk Bytes/transfer | |
| Current Disk Queue Length (Applies to both LogicalDisk and PhysicalDisk Objects) |
The Memory: Pages/sec counter watches pages that are swapped and written to your disk drive. Remember that the virtual memory of your system is kept in a file named PAGEFILE.SYS that is located on your disk drive. If you monitor this counter and the %Disk Time counter, you will see how much the PAGEFILE.SYS affects the overall performance of your system. Exercise 14-11shows you how to add the Memory: Pages/sec counter to Performance Monitor. This counter can be used to indicate that there is not enough physical memory in your system.
Exercise 14-11 Adding Memory: Pages/sec to the Performance Monitor
The %Disk Time counter shows how much time the processor is spending servicing disk requests. It can be a broad indicator of whether your disk drive is a bottleneck. If you use this counter in addition to the Processor:%Processor Time counter used earlier in this chapter, you can see whether disk requests are using up your processor time. Exercise 14-12 shows you how to measure the amount of time that is being used servicing disk requests. For this exercise we will stay at the high level and use the LogicalDisk Counter.
Exercise 14-12 Adding LogicalDisk: %Disk Time to the Performance Monitor
The Disk Bytes/sec counter shows you how fast your disk drives are transferring bytes of data. This is the primary measure of disk throughput. Exercise 14-13 shows you how to add this counter to Performance Monitor.
Exercise 14-13 Adding LogicalDisk: Disk Bytes/sec to the Performance Monitor
If you have more than one disk drive, copy a few large files from one disk drive to another disk drive, while you monitor the Disk Bytes/sec counter to see the speed at which your drives are performing.
The Average Disk Bytes/transfer counter measures throughput of your disk drive. The larger the transfer size, the more efficient your disk drive performs and the faster your system executes. Exercise 14-14 shows you how to monitor the Average Disk Bytes/transfer counter.
Exercise 14-14 Adding LogicalDisk: Average Disk Bytes/Transfer to the Performance Monitor
The Current Disk Queue Length counter shows how much data is waiting to be transferred to the disk drive. It measures requests, not time. It includes the request being serviced and those waiting. A disk queue of more than two can indicate that the disk drive is a bottleneck. Exercise 14-15 shows how to add this counter to Performance Monitor.
Exercise 14-15 Adding LogicalDisk: Current Disk Queue Length to the Performance Monitor
Now that you have completed measuring different counters using the Disk Drive Performance Counters, it is time for you to disable them so they do not degrade system performance when they’re not in use. Exercise 14-16 shows you how to disable the counters.
Exercise 14-16 Disabling the Disk Performance Counters
Disk Drive Performance Troubleshooting
Once you have determined that the disk drive in your system is causing the bottleneck, do not immediately go out and buy another disk drive. There are some things you can check within your system to see if they could be causing the disk drive to be a bottleneck.
| Check to see that you have plenty of physical memory in your system. By having as much physical memory in your system as possible you increase the size of your disk cache and reduce the size of your pagefile. By reducing the need to go back to your disk drive for data, or to swap pages into or out of the pagefile, you increase the performance of your system immensely. | |
| Check your disk drive controller card. If you have a card that transfers in 8-bit or 16-bit increments, you would see a drastic improvement by switching to a 32-bit controller card. If possible, make sure that the 32-bit controller card is a bus-mastering direct memory access (DMA) controller, rather than a controller that uses programmed I/O. Programmed I/O uses the processor to setup disk drive transfers. A bus-mastering DMA controller uses the disk drive controller to manage the I/O bus, and the DMA controller to manage the DMA operation. It leaves the processor free for other uses. |
If you have determined that you do indeed need another disk drive, and you are going to add it to your existing disk drive configuration, place the drives on separate I/O buses to ensure maximum performance potential. There are also some things you can do to improve disk drive performance when you have more than one disk drive in your system.
| Check to see if you have enough disks drives to use a disk drive stripe set. Using a stripe set can increase the speed of a logical disk by splitting it across 2 – 32 physical disk drives. Disk drives operate simultaneously, and you can see a speed increase from a stripe set up to the maximum speed of the bus. Stripe sets are created using the Disk Administrator that is covered in Chapter 5. | |
| You also might want to use a Redundant Array of Inexpensive Disks (RAID) controller card along with multiple disk drives. A RAID controller card contains its own processor and cache memory that speed up the transfers to and from the controller card. This also translates into improved system performance, as there is no load placed on the system processor or system memory when utilizing a RAID controller. RAID controllers are expensive and usually only installed in a system that is being utilized as a server. |
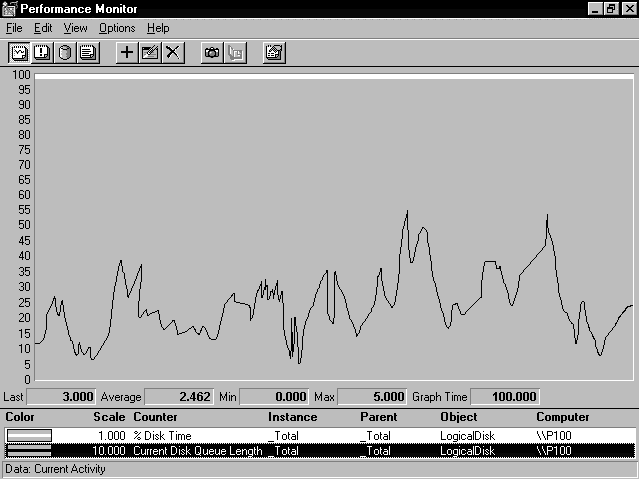
Figure 14-10 shows an example of a situation in which a faster disk drive is needed. The white line displays the %Disk Time at a sustained rate of 100%. The black line is the Current Disk Queue Length that has had a maximum of 5 items in the queue, and the average has been about 2.5 items.
Memory can contribute significantly to creating a bottleneck in your system and is normally the most common source of bottleneck. Windows NT uses a virtual memory system that consists of a combination of physical memory, a virtual memory pagefile that is located on a disk drive, and hard disks where applications and data can exist. Data is stored on the disk drive until needed and then moved into physical memory. Data that is no longer actively being used can be written back to the disk drive. However, if a system does not have enough physical memory, data has to be moved into and out of your disk drive more frequently, which can be a very slow process. Data pages that have recently been referenced by a process are stored in physical memory in a working set. If the process needs data that is not in the working set, it creates a page fault, and the memory manager adds new pages to the working set.
The first step you should take in investigating a suspected memory problem is to measure the amount of paging that is occurring. There are three important counters you should use when you investigate a memory bottleneck. They indicate how often a process has to look outside of its working set to find data it needs. The three counters are:
| Memory:Page Faults/sec | |
| Memory:Pages Input/sec | |
| Memory:Page Reads/sec |
The Memory:Page Faults/sec counter measures the number of times that data is not found in a process’s working set. This includes both hard page faults, in which additional disk drive I/O is required, and soft page faults, in which the pages are located elsewhere in memory. If you continuously experience a lack of data being found in the process’s working set, the amount of memory in your system is probably too limited. The best indicator of a memory bottleneck is a continuous, high rate of hard page faults. Exercise 14-17 shows you how to add this counter to Performance Monitor.
Exercise 14-17 Adding Memory:Page Faults/sec to the Performance Monitor
The Memory:Pages Input/sec counter is used to see how many pages are retrieved from the disk drive to satisfy page faults. This counter can be used in conjunction with Memory:Page Faults/sec to see how many faults are being satisfied by reading from your disk drive, and how many might be coming from elsewhere, such as other locations in memory. Exercise 14-18 shows you how to add this counter to Performance Monitor.
Exercise 14-18 Adding Memory:Pages Inputs/sec to the Performance Monitor
This counter reflects how often the system is reading from your disk drive due to page faults. If you sustain more than five pages per second, you have a shortage of physical memory. Exercise 14-19 shows you how to add this counter to the Performance Monitor.
Exercise 14-19 Adding Memory:Page Reads/sec to the Performance Monitor
Memory Performance Troubleshooting
Once you have determined that the memory in your system is causing the bottleneck, you might want to rush out and get more physical memory. It might not be necessary to add more physical memory, even though it never hurts to have as much physical memory as your system can handle. There are some things you can check within your system to see if they could be causing the memory to be a bottleneck.
| Check the size of your L2 cache if you have recently added physical memory to your system. The L2 cache has to map the larger memory space that occurs after physical memory has been added to a system. | |
| Check to see if you have any drivers or protocols running that are not in use. They use space in all memory pools even if they are idle. | |
| Check to see if any of your applications have memory leaks by monitoring their use. | |
| Check to see if you have additional space on your disk drive that you can use to expand the size of your pagefile. Normally, the bigger your pagefile is, the better. This is especially true if you have recently added memory to the system. PAGEFILE.SYS might need to expand to map the additional memory. If the PAGEFILE.SYS cannot expand, it could appear as a memory bottleneck. |
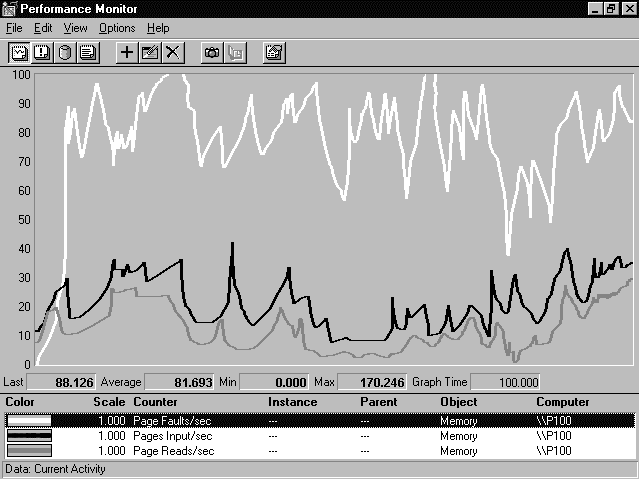
Figure 14-11 shows an example of the three memory counters that we discussed in this section. The white line is the Page Faults/sec, which is the total page fault rate during this measurement, and it averages 81 per second. Page faults do cause an interruption to the processor, but to significantly slow the system down takes a hard page fault. The black line is Pages Input/sec that measures the hard page faults by counting the number of pages that have to be taken from disk drive to satisfy the fault. The area between the white and black lines shows the amount of soft page faults during this measurement. Remember that a soft page fault is a page that was found elsewhere in physical memory, such as cache memory. The dark gray line is the Page Reads/sec, which is the number of times the disk drive had to be read to satisfy a page fault.
To optimize your Windows NT system, it is important to take all the steps available to improve performance capability. Windows NT assists you in this endeavor by providing counters for every object that the operating system can measure. Windows NT can use the counters for automatic self-tuning, and they also can be used manually with Performance Monitor.
Some of the self-tuning that Windows NT performs automatically is in the areas of: thread and process prioritization, caching disk requests, multiprocessing capability, utilizing multiple pagefiles, and avoiding fragmentation of physical memory.
The Performance Monitor tool that is shipped with Windows NT allows you to be very granular, when investigating the performance of your system, by measuring different objects and counters. The Performance Monitor displays in real time what is occurring within your system and helps you to isolate a bottleneck rapidly.
A bottleneck is something within your system that is prohibiting the system from operating at peak efficiency. The three main areas to concentrate in looking for a bottleneck are Processor Performance, Disk Drive Performance, and Memory Performance.
Performance-tuning a Windows NT system is an ongoing process that starts with finding and resolving the most significant bottleneck. After resolving the most significant bottleneck, find the next most significant one, and keep doing this until you resolve all possible bottlenecks. After you resolve all possible bottlenecks, your system will achieve the greatest performance possible.
| Tuning your system is an ongoing process. | |
| To determine a bottleneck in your system, you must evaluate a set of metrics based upon the number of requests for service, the arrival time of the requests, and the amount of time requested. | |
| The Task Manager is a useful tool for short-term monitoring of your system, and can be extremely valuable in detecting an application or Windows NT service that has become a CPU or memory bottleneck. | |
| Windows NT ships with several mechanisms in place to assist with optimizing your system performance automatically. |
| Methods to avoid fragmentation of physical memory | |
| Utilizing multiple pagefiles | |
| Multiprocessing capability | |
| Thread and process prioritization | |
| Caching disk requests |
| Identify bottlenecks | |
| Identify trends over a period of time | |
| Monitor real time system performance | |
| Monitor system performance history | |
| Determine the capacity the system can handle | |
| Monitor system configuration changes |
| Processor:%Processor Time | |
| Processor:Interrupts/sec | |
| System:Processor Queue Length |
The following Self-Test questions will help you measure your understanding of the material presented in this chapter. Read all the choices carefully, as there may be more than one correct answer. Choose all correct answers for each question.
2. While using the Processor:%Processor Time counter in Performance Monitor you see it spike to 100% when starting an application, but then it drops to 43%. What do you need to do?
3. Windows NT divides memory into ____ pages.
4. Windows NT Workstation supports ____ processors.
5. (True/False) It is not possible to change the priority of the foreground application so that it runs at the same priority as all background applications.
6. By how many levels can Windows NT automatically adjust the priority of an application?
7. You suspect a disk drive is creating a bottleneck within your system. You use the LogicalDisk:%Disk Time counter to take measurements, but have a consistent reading of zero. What is the problem?
8. Multiprocessing supported by Windows NT is ____ .
9. (True/False) Using two processors in your Windows NT system doubles the performance capability.
10. Where does Windows NT perform automatic self-tuning optimizations?
11. The cache system used by Windows NT is ____ .
12. The Disk Drive Performance Counters are enabled using what utility?
13. (True/False) The Task Manager cannot be used to change the priority of a thread.
14. Using Performance Monitor, you have determined that you have a disk drive bottleneck. What action could alleviate this problem?
15. Using Performance Monitor, you have determined that you are encountering a memory bottleneck. What action will eliminate it?
16. (True/False) Hard page faults are more detrimental to system performance than soft page faults.
17. (True/False) Once you have manually performance-tuned your system, you never have to do it again.
18. (True/False) Disk Drive Performance Counters should only be enabled when monitoring disk drive performance.
19. How would you change the priority of an application that is already running?